Behavioural analytics

Footfall and sales tell you what happened.
The journey tells you why.

Footfall counts who came in. Transactions count who bought. Everything that decided which was which - the display they stopped at, the aisle they never reached, the queue they gave up on - happened in between.

Behavioural analytics measures that middle, through the same cameras that count the door.

Retail behavioural analytics diagram
Understanding customer behaviour

Two customer journeys in every visit


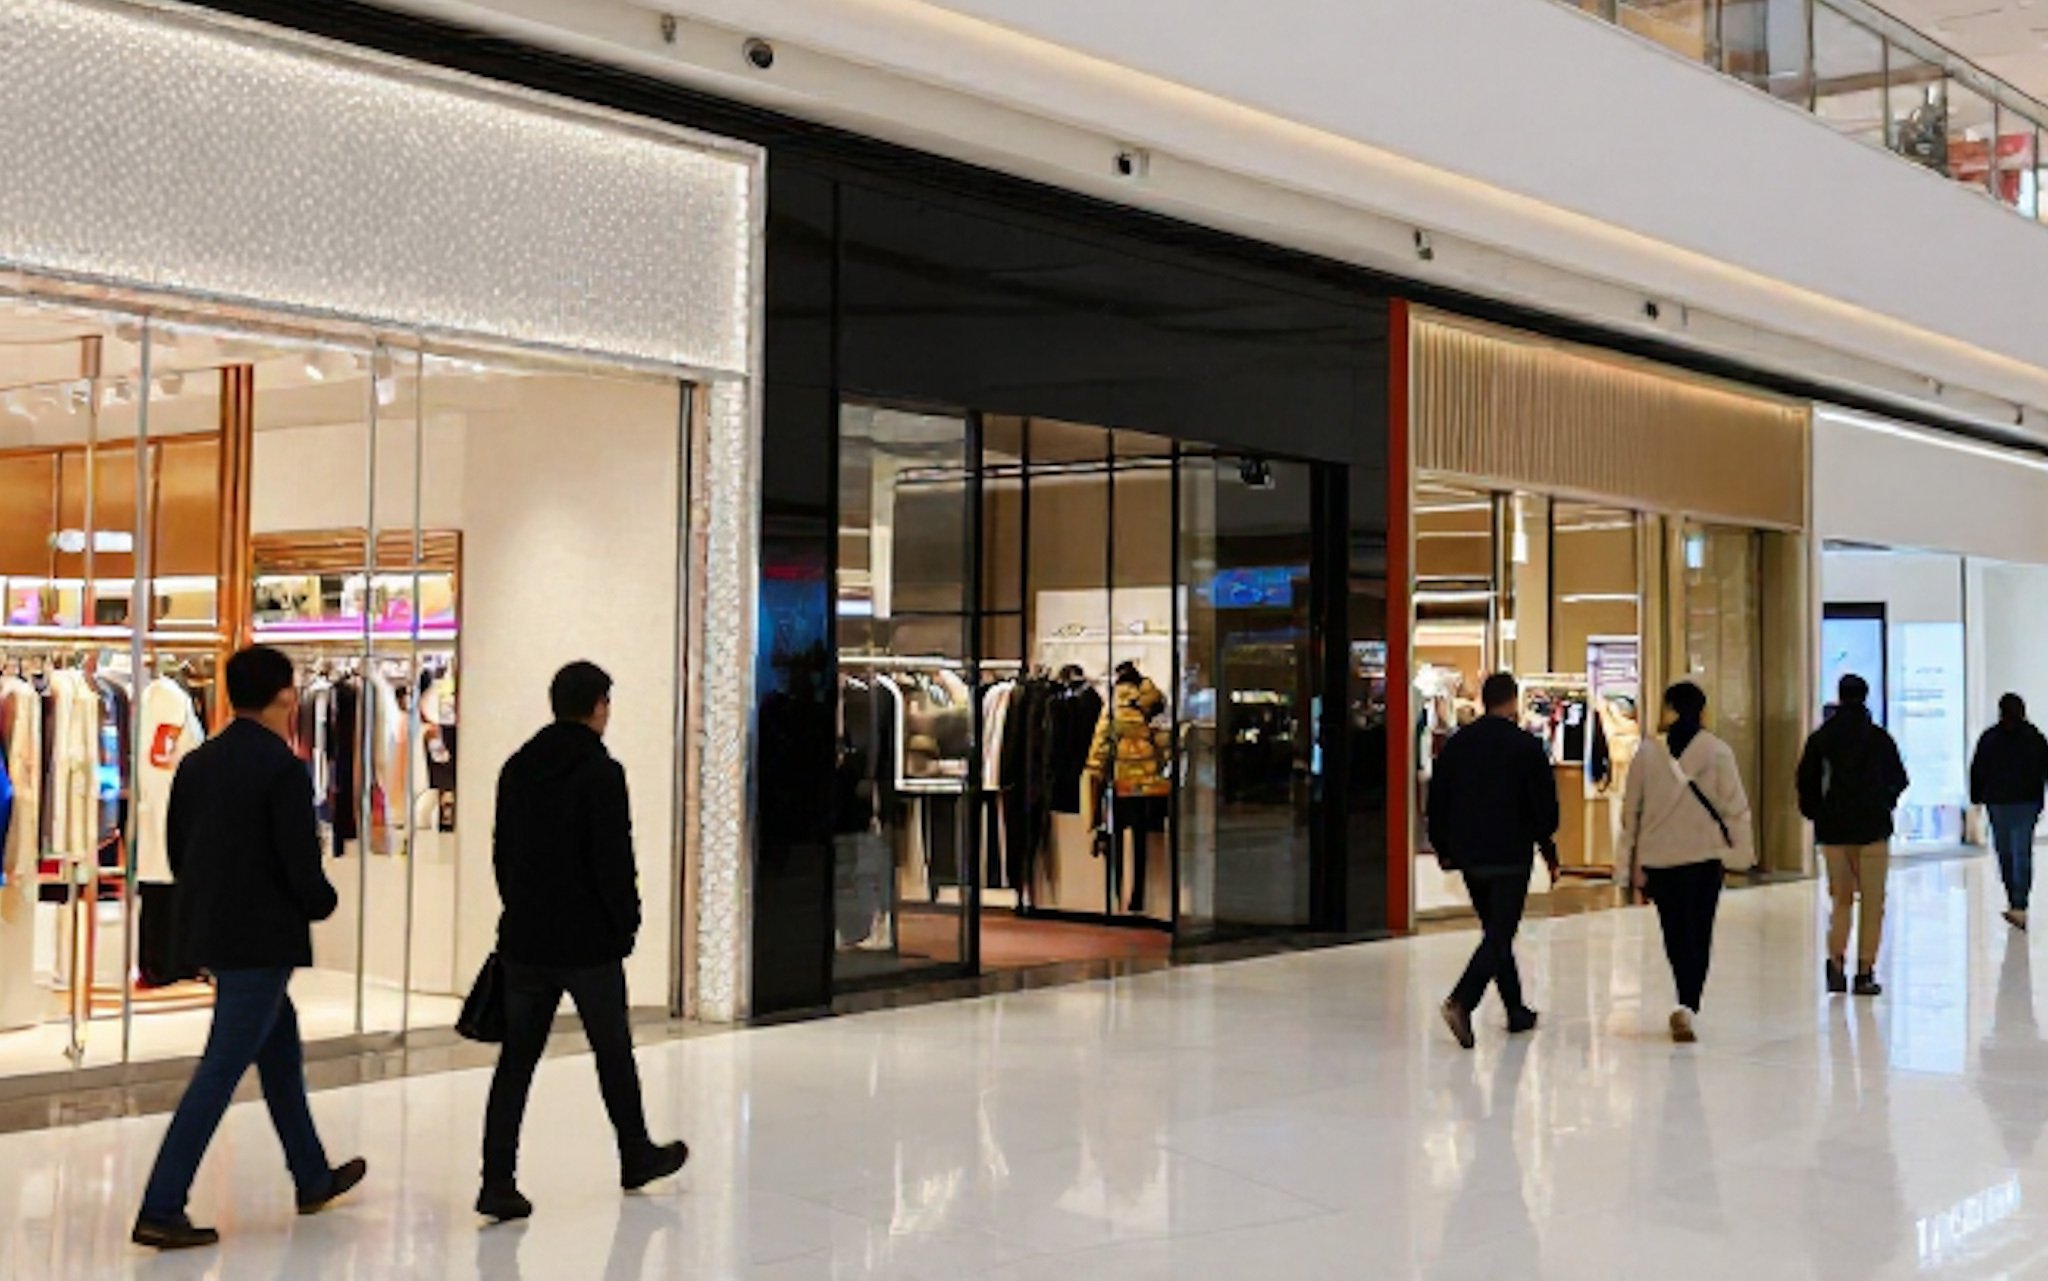
  • IMG_7659 2
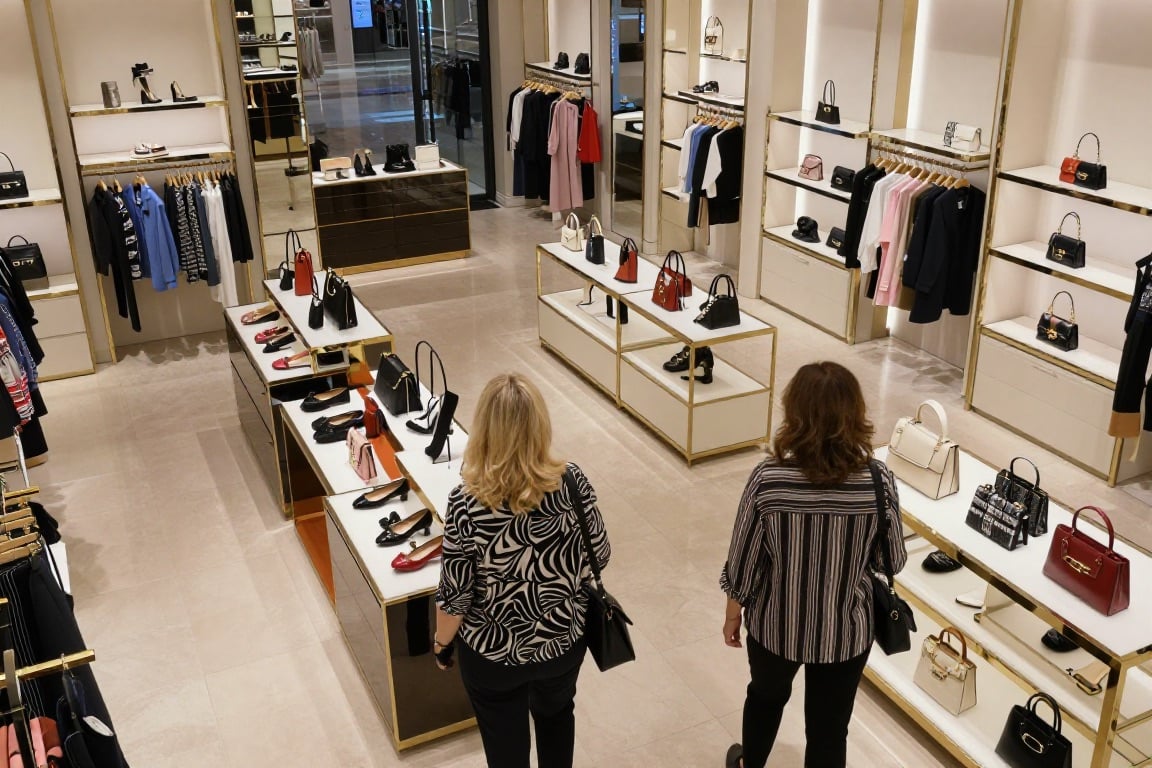
  • retail store interior wide view
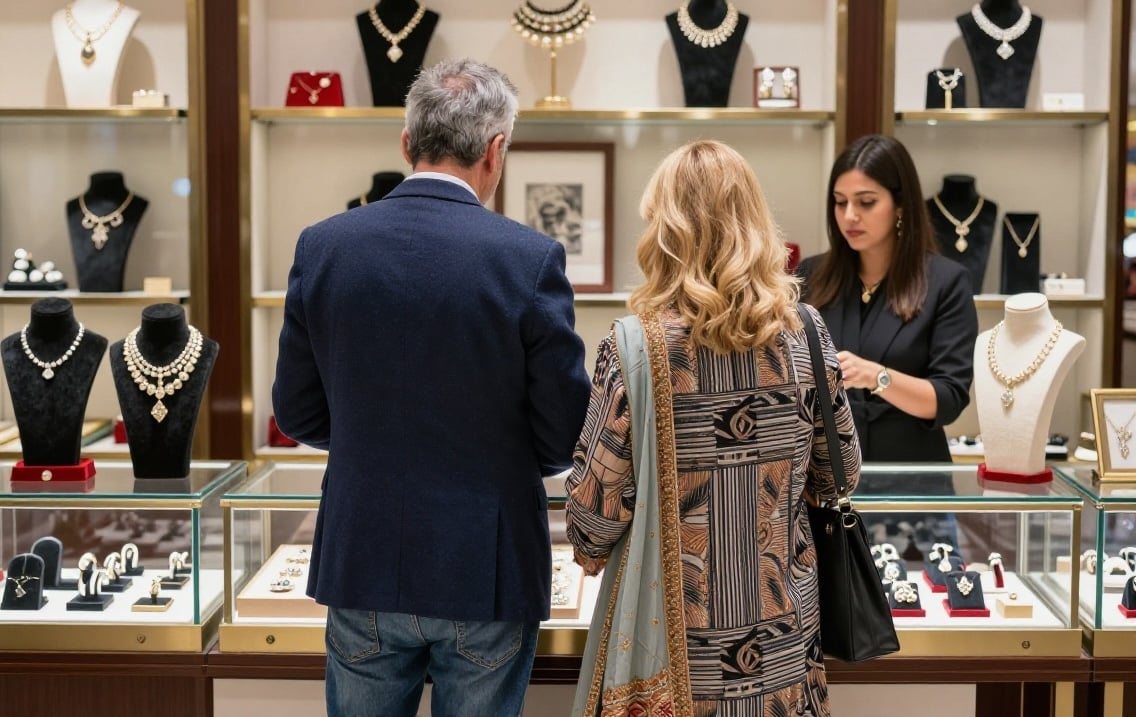
  • jewellery store sales interaction

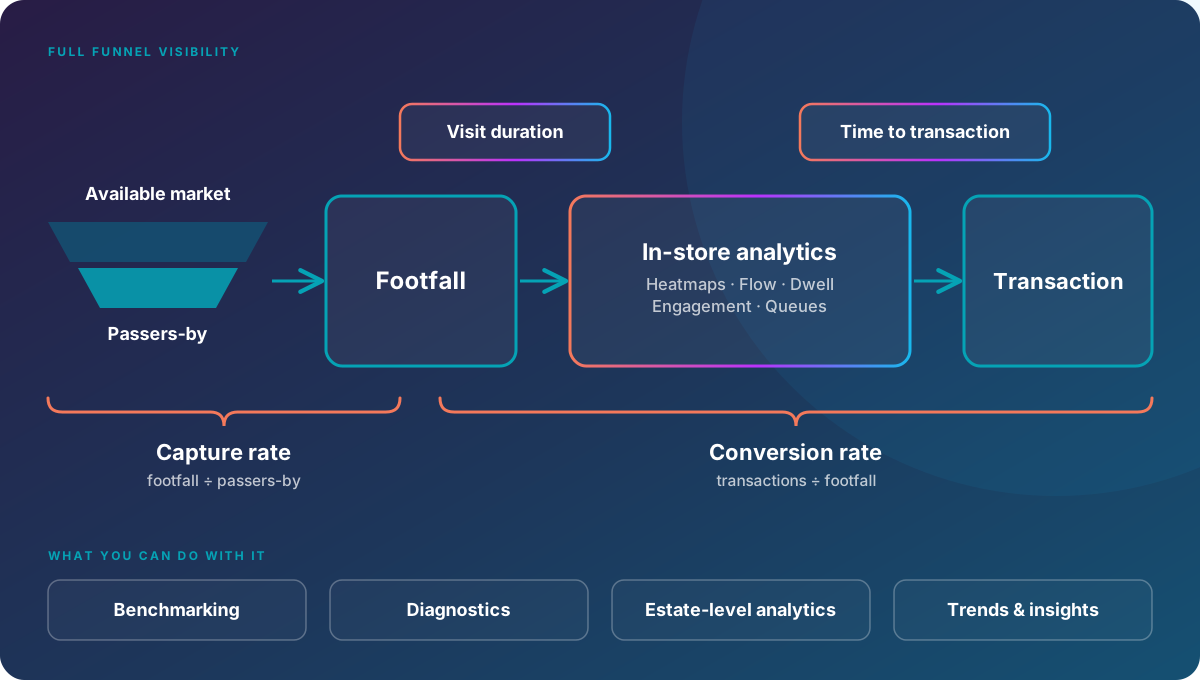
The entry journey is what happens before the door: who walked past, what they saw, and whether they chose to come in. Its measure is capture rate - footfall as a share of passers-by - and its owner is the storefront: windows, signage, lighting, whether the door is open.

The purchase journey is what happens after it: where the visitor went, what they stopped at, what they walked past, whether they found what they came for, how long they queued and whether they gave up. Its result is conversion, but its causes are in the walking, the stopping and the waiting.

Footfall and transactions measure the end of both journeys precisely. To change the outcome you have to see inside them, and that is what behavioural analytics measures.

Full funnel visibility

From passer-by to purchase, and everything in between


Glimpse measures the whole funnel through the cameras that already count your doors, plus our own sensors where a camera can't see.

  • Available market and passers-by. How many people walk past the store entrance - this is the top of the funnel and the denominator for capture rate.
  • Footfall. The validated, de-duplicated count the rest is built on.
  • In-store analytics. Heatmaps show where people go and where they don't; flow shows the routes they take; dwell zones measure how long they stay at a fixture, a display or a concession; engagement credits a placement with the shoppers it actually held; queue monitoring measures how long they wait, with alerts before they walk away.
  • Visit duration and time to transaction. How long the average visit lasts, how long a buyer takes to buy - and whether the people who leave without buying leave quickly (they didn't find it) or slowly (they found it and still didn't buy).
  • Transaction. Conversion and sales value imported from your POS.

Because every measure sits on the same platform, in the same hierarchy of estate, region, store and zone, you can benchmark stores against each other, diagnose the ones that lag, analyse the estate as a whole and follow trends over time. That is the performance optimisation work the next page is about.
funnel-after-1
What we measure

What happens between the door and the till

Eight measures from the same cameras and the same platform as the footfall count. Every one builds on top of footfall, and each answers a question about the visit itself.


Flow

How people move through your space: routes taken, zones visited, dead ends avoided. Internal footfall lines count visitors to fitting rooms, concessions and departments.

Does the layout help or hinder?

Dwell time

Time spent in any zone, a department, a concession, a fixture - measured from polygonal zones drawn in the camera view, with pass-through traffic filtered out.

Where do shoppers actually stop?

Engagement

Who stops, who interacts, and for how long. Dwell in front of displays, fixtures and retail media. Measured using wireless sensors for easy deployment.

Which displays actually work?

Heatmaps

Where visitors congregate and dwell over time. Identifies the hotspots, the walkways and the dead zones that underperform. The starting point for layout and merchandising decisions.

Where do customers go?

Space utilisation

Heatmaps and dwell zones combined to show which areas earn their space and which don't. Provides evidence for layout, range and leasing decisions.

Is every square metre working?

Occupancy

Live counts of how many people are in any space, area or vehicle, with alerts when a threshold is crossed. For service levels, staffing and safety.

Are we using our capacity?

Queue monitoring

Queue lengths and wait times, with real-time alerts before waiting turns into walking away. Monitor checkouts, self-service, concessions, and ticket machines.

Where does friction cost us sales?

Real-time alerts

Thresholds on occupancy and queue length that notify your team the moment they're crossed, e.g. a queue building at self-checkout or a floor approaching capacity - so the data prompts an action while it can still change the outcome.

Can we act before it costs us?
Common questions

Behavioural analytics, answered


What is behavioural analytics in retail?

The measurement of what shoppers do between entering and leaving: where they go (flow), where they stop and for how long (dwell and engagement), where they congregate (heatmaps) and where they wait (queues). Glimpse measures it anonymously from CCTV and sensors, on the same platform as footfall, so behaviour can be read against the count and the conversion it produced.

How is dwell time measured?

Zones are drawn as polygons in the camera view. This could be a fixture, a department, a queue. The system measures how long each anonymous position stays inside the zone and filters out people passing straight through, so dwell reflects the shoppers who actually stopped. Data is recorded at minute level and rolled up by hour, day, week and month.

Does behavioural analytics mean tracking individuals?

No. People are detected as anonymous positions - a box, not a face - and a temporary ID follows a position only within a camera view, so that a person is counted once and their dwell is measured correctly. There is no facial recognition, no identity, nothing stored, and no tracking of an individual between visits or between stores.

Can we get heatmaps and dwell from our existing CCTV?
Yes, for any area a camera can see with a usable view, which in most stores is the majority of the floor. The site survey maps which zones your cameras cover; where a display or a frontage isn't covered, a Glimpse Sensor measures dwell or passers-by there.
What's the difference between footfall analytics and behavioural analytics?

Footfall analytics measures the door: how many people came in, when, and (with passers-by and transactions)  capture rate and conversion.

Behavioural analytics measures the visit between the door and the till. You need the first to make sense of the second, and Glimpse gives you both from the same cameras.

Next: performance optimisation

Seeing the journey is the start. Changing it is the point.


Heatmaps, dwell and capture rate are only worth having if someone uses them to decide something: which window to change, which fixture to move, which store to fix first, which till to open. That is what turns a dashboard into a tool - and it's what the next page is about.
Next: Performance optimisation →

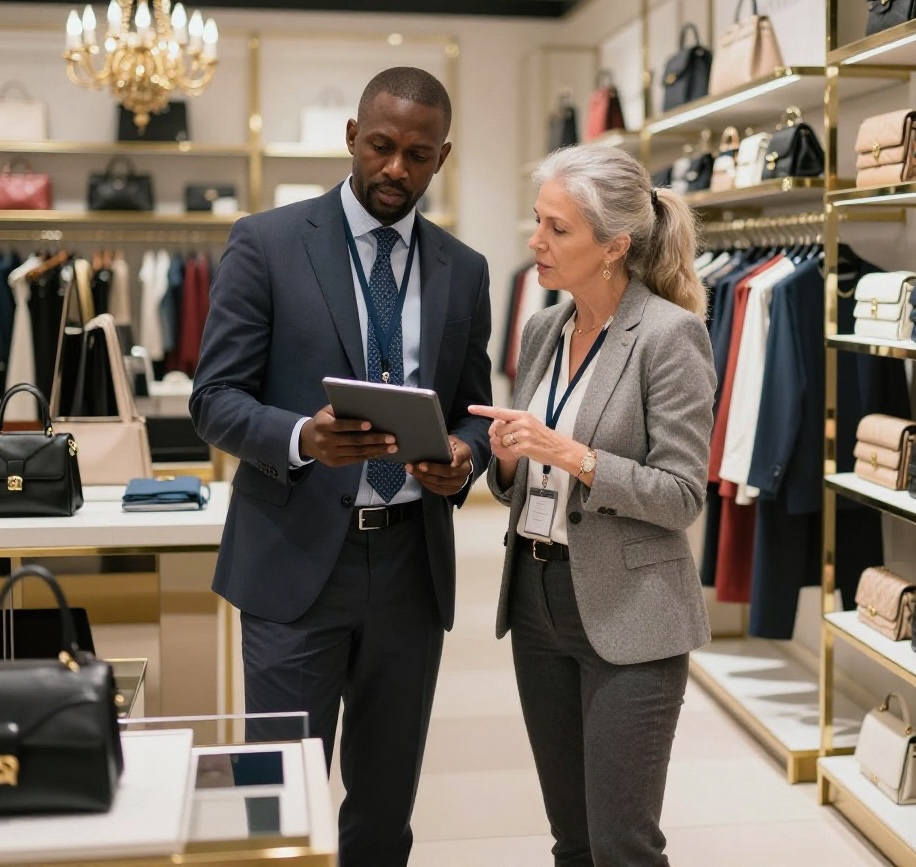
store staff talking

Ready to see what your spaces could be doing?

A discovery session is a structured conversation about your estate, your challenges and your objectives, and an honest view of the performance opportunity.

No obligation. No hard sell. Just a clearer view of what's possible.