Performance optimisation

Sales are down. Is it the street, the storefront, or the shop floor?

Fewer people passing, fewer coming in, or fewer buying are three different problems with three different owners.

Glimpse tells you which one moved, store by store, hour by hour, and whether what you did about it worked.
performance loop

Trusted by the world's biggest retailers, brands, transport operators and property groups

HarrodsMarks & SpencerCosta CoffeeHotel ChocolatMejuriLGBacardiJack Daniel'sLandsecSavillsSouth Western Railwayc2cExCeL LondonFarmer's Fridge
Where the gains are

Three levers, and the numbers that tell you which to pull

A dashboard tells you what the numbers are. A tool helps you change them.
Glimpse is built to be used - to test a window, move a fixture, open a till, re-plan a rota - and then to tell you, hour by hour, whether it worked.

IMG_7659 2

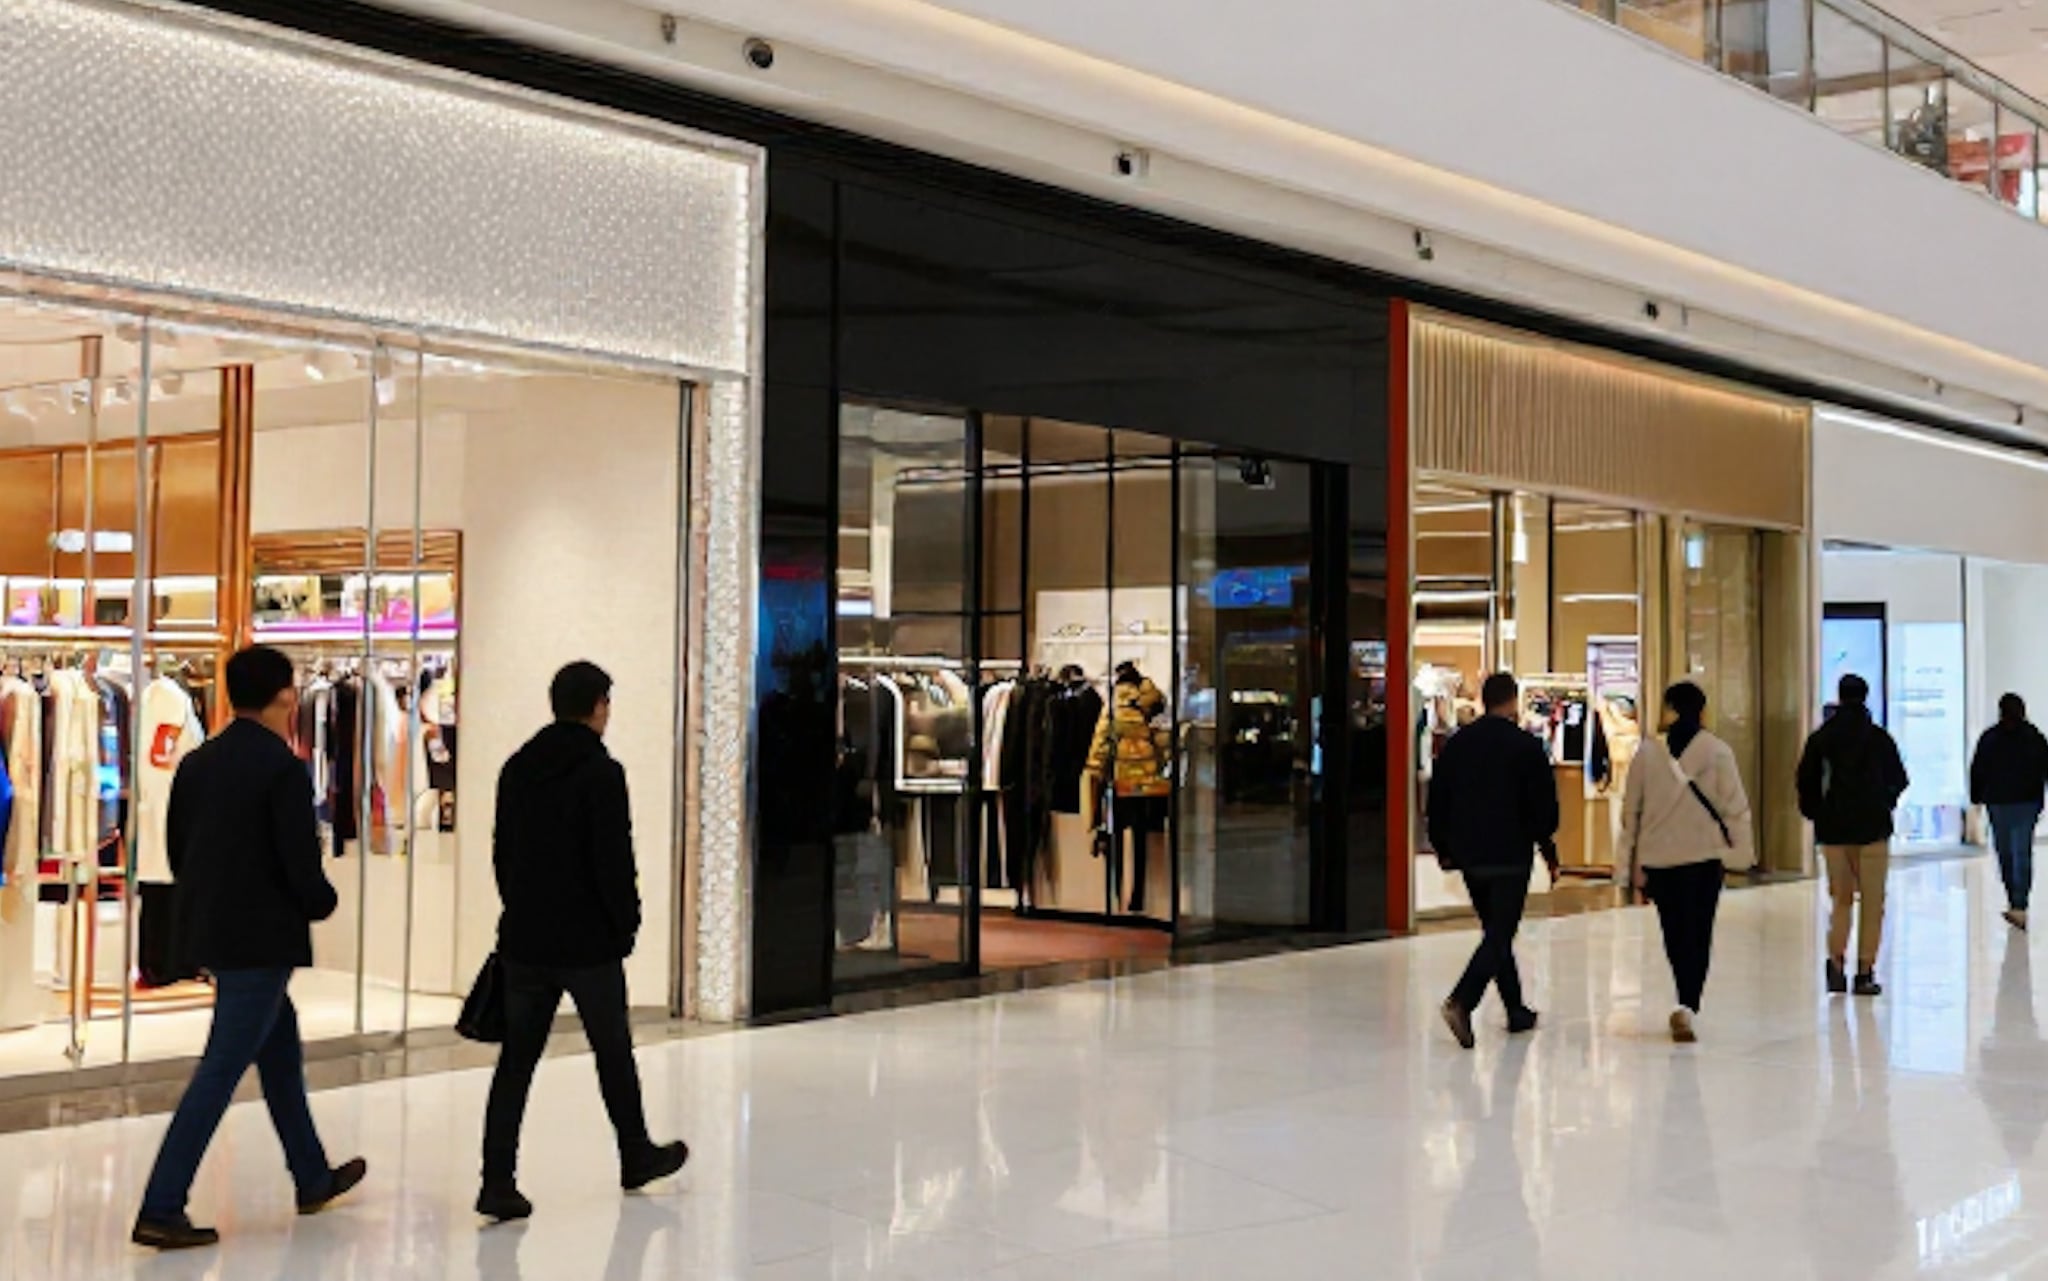
Get more of the street in

The street is as busy as ever, but a smaller share of the people walking past choose to come in. Windows, A-boards, lighting, whether the door is open, the promotional message.
Owner: Marketing and visual merchandising.
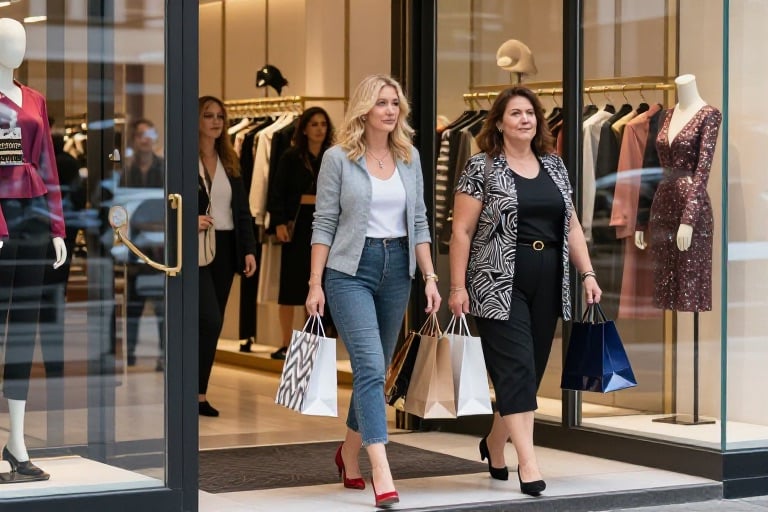
Capture ratethe storefront lever
Retail footfall

Turn more visitors into buyers

People are coming in, but fewer are buying. They didn't find it, they engaged but didn't convert, or the queue sent them away. Layout, range, staffing, service.
Owner: Store operations.
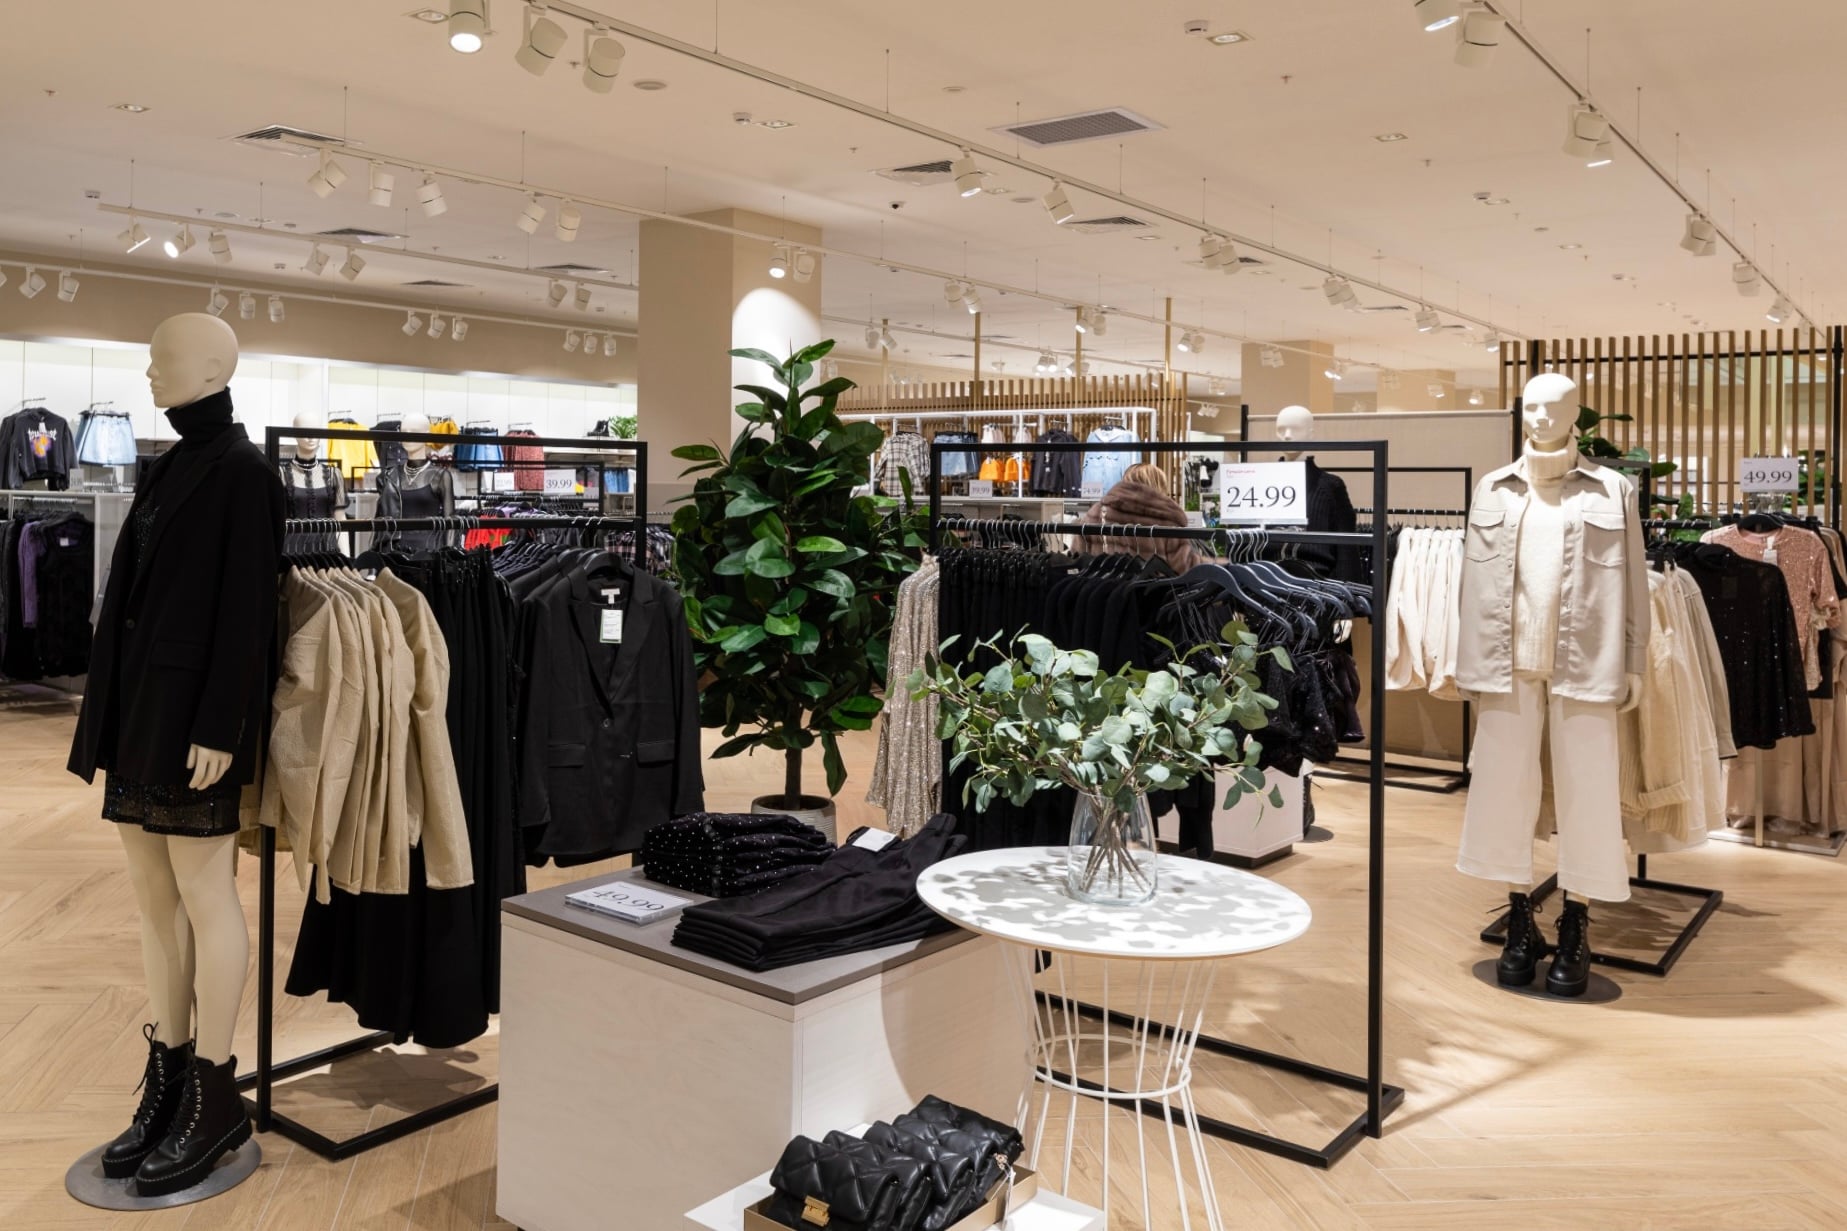
Conversion the shop-floor lever
Untitled - 21 September 2026 at 15.40.08

Do it with the same people and space

Measure footfall by hour against the rota, queue length against tills open, dwell against square metres. Allocate staff to demand, open a till before the queue forms, give space to what earns it.
Owner: Operations and property.

Efficiencythe operations lever

Different levers, different owners. The playbook below is how each one gets pulled.
The playbook

Six things retailers do with Glimpse data

Specific, repeatable, and measurable afterwards. None of them needs a data scientist. All of them need the footfall count to be right.


Win the doorway

Lift capture rate, store by store

Compare capture rate across like-for-like stores and find the ones where the street is busy but the door is quiet. Change the window, the entrance, the signage, one thing at a time, and read capture rate the following week against the store's own baseline and its peers.

The extra visitors were already outside.

Test, don't guess

A/B test in physical stores

Make the change in one store or a few, hold the rest as the control, and measure the difference in capture rate, dwell or conversion hour by hour. Weather, day of week and season hit the control stores too, so the comparison strips them out.

Keep what works, revert what doesn't, roll out with evidence.

Fix the floor

Optimise the layout

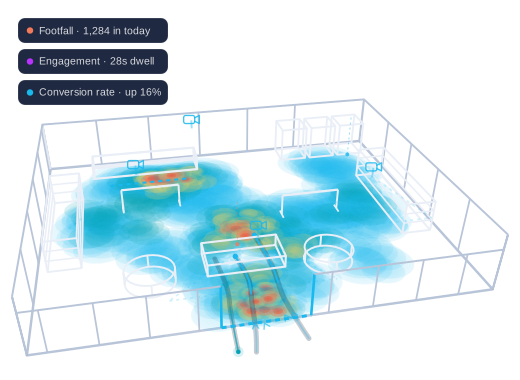
Heatmaps show where people go and the dead zones they never reach. Dwell zones show which fixtures hold them and which they walk past. Move the fixture, re-route the aisle, re-site the concession, then watch the heatmap change.

A luxury department store lifted product and concession engagement by 22% this way.

Staff to demand

Match staff rota to footfall, open tills to queues

Footfall by hour and day shows when the store is actually busy, not when the rota assumes it is. Queue alerts tell the floor a line is building before customers give up.

Conversion by hour shows where service, not demand, is the constraint.

Manage retail media

Measure engagement with displays, media and concessions

Engagement credits a display, a screen or a concession with the shoppers it actually held, not everyone who walked past.

Evidence for a retail media rate card, a concession negotiation or a supplier-funded fixture.

Prioritise the estate

Which stores do we fix first?

Compare every store on the same measures, find the outliers, and quantify the opportunity before you act. Fix the three stores with the biggest number first.

Opportunity = capture-rate gap × passers-by × conversion × average transaction value.

Data to drive decisions

Performance metrics


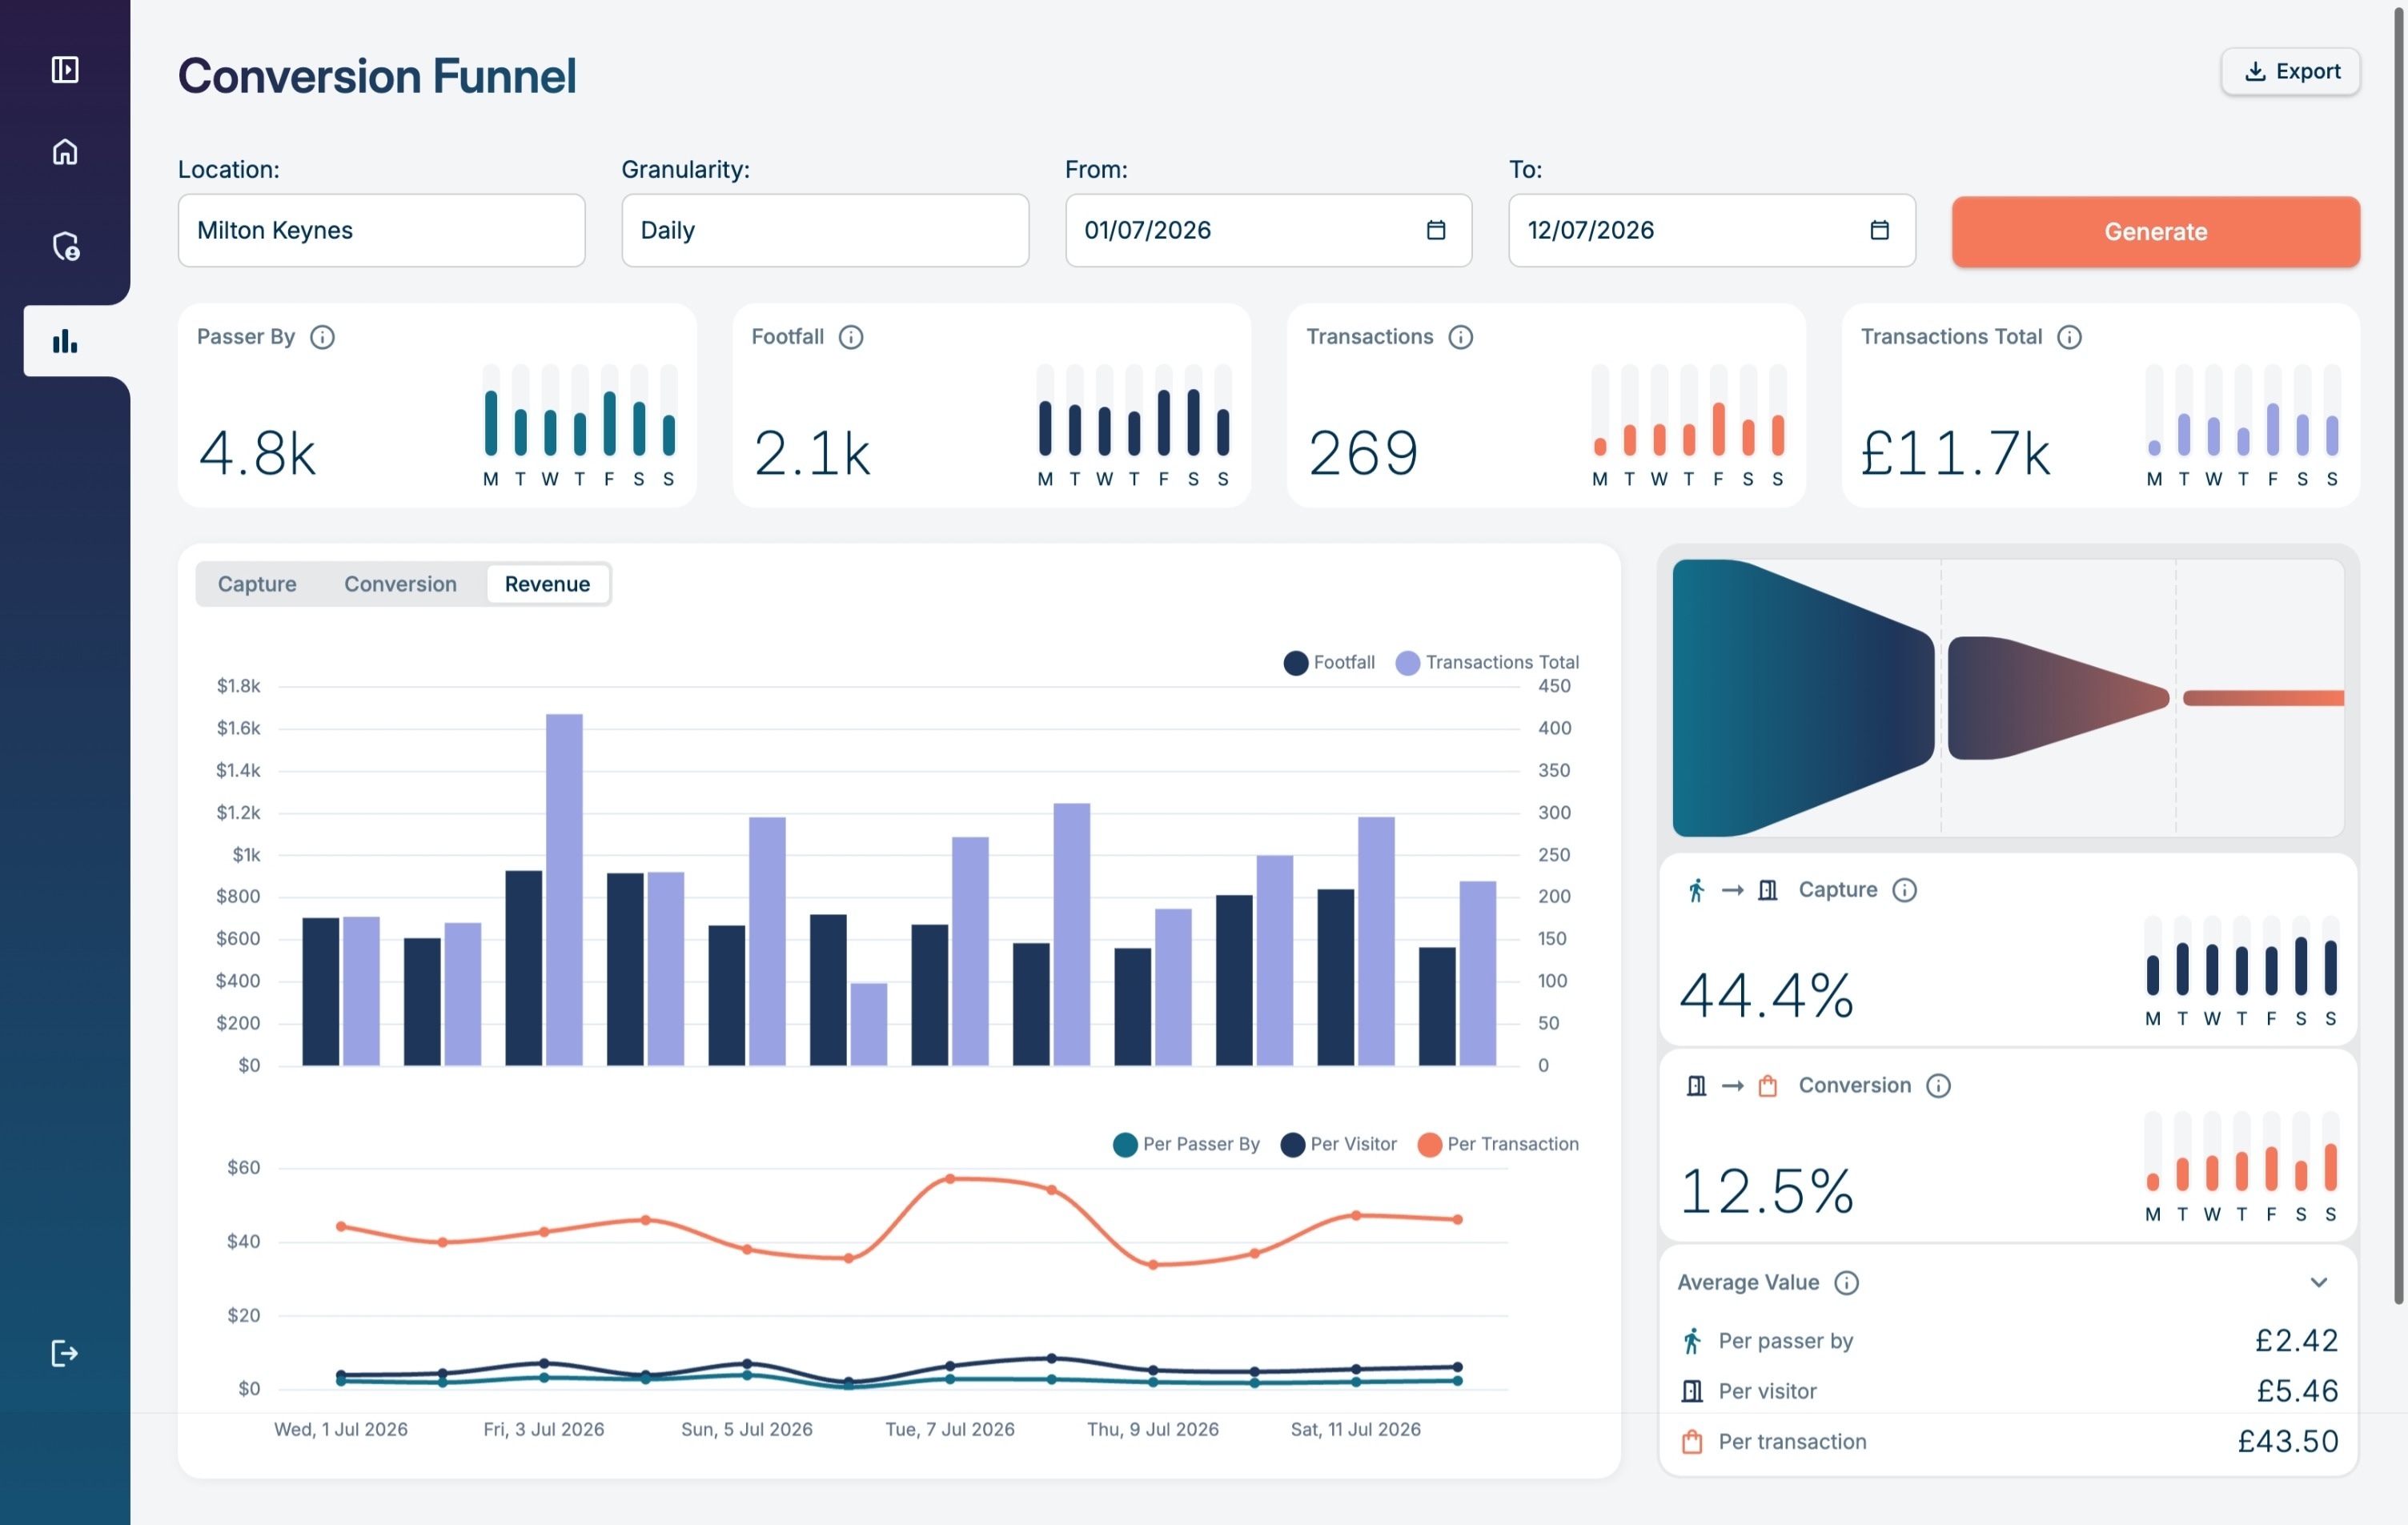
Glimpse combines passer-by counts, footfall, and transactions to build a complete conversion funnel for each store, with the following metrics: 

  • Passer-by - The size of your available market, how many potential visitors walked past the store
  • Footfall - Accurate, validated counts of how many people entered
  • Capture rate - Measure of storefront performance, the proportion of passers-by who came in
  • Conversion rate - Measure of shop floor performance, the proportion of visitors who made a purchase
  • Average transaction value - spend per paying customer
  • Sales per visitor - what an individual visitor is worth to the store, whether or not they bought anything
  • Sales per passer-by - puts a value on each potential extra visitor to the store
Conversion funnel full with sales per visitor-1
The maths

What a two-point capture rate gap is worth


Take a store with 6,000 passers-by a day, converting at 20% with an average transaction of £42, and a capture rate of 12% where its like-for-like peers manage 14%. Closing that two-point gap brings in 120 more visitors a day. At the same conversion rate that's 24 more transactions, just over £1,000 a day, roughly £30,000 a month - from people who were already walking past the shop.

Glimpse data can quantify that for every store in the estate before you change anything, so the effort goes where the number is biggest. 
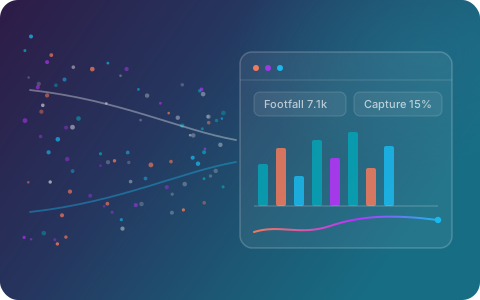
Scattered data points resolving into a dashboard card showing footfall and capture rate

Try it with your own numbers

Change any figure and the result updates. Start from the store in the example.

Closing the capture rate gap brings in:

  1. –more visitors a day
  2. –more transactions a day
  3. –more sales a day
  4. –more sales a month

Illustrative arithmetic on the figures you enter. It runs in your browser, no data is sent or stored.

Evidence

What changed, in our clients numbers


97%average counting accuracy, validated against manual counts before every go-live
650stores deployed for a single leading retail estate
22%increase in product and concession engagement at a luxury department store
£61kaverage monthly sales increase following deployment

"Glimpse transformed our understanding of concession placement and shopper behaviour, providing insights that optimised store layout and improved customer engagement."

Head of customer experience, luxury department storeHead of Customer Experience — luxury department store
Read the case study →
UK GDPR compliantISO 27001Cyber Essentials certifiedNo facial recognition Privacy-safe by design: no video stored, no personal data retained.
Common questions

Performance optimisation, answered


Can you A/B test in a physical store?

Yes. Make the change in a test store or group, keep comparable stores as the control, and compare capture rate, dwell or conversion between them hour by hour. Because day of week and season affect the control stores too, the difference between the groups is the effect of the change.

Who does the analysis - you or us?

Both. Your teams use the Glimpse Portal and report exports day to day. Our client success team runs estate-level analysis and regular success reviews with you, and insight workshops as the partnership matures — see Our approach.

Does it work with our BI and reporting tools?

Yes. Everything in the Portal is available as JSON through the REST API or can be exported as CSV for further analysis.

How quickly will we see results?

Data flows from the day a site goes live. Changes to a window or a layout show in capture rate and dwell within days; conversion and staffing effects within weeks.

A typical engagement starts with an 8–12 week proof of concept and ends with an executive review, the business case and a rollout roadmap.

What would our return on investment be?

It depends on the metric you're trying to change - are you looking to increase conversion from customers inside the store, or to attract more customers in from outside?

We've provided an example ROI calculator to model the impact of increasing capture rate - try it out with your own numbers!

Next: how it works

All of this, from the cameras you already own.


Everything here comes from one platform, fed by your existing CCTV where it can see, Glimpse Sensors where it can't, and Glimpse in a Box where there's nothing to connect to.

Video is processed on site and never stored; only metadata leaves the building. How that works - the pipeline, the three ways to deploy, how accuracy is validated and how privacy is designed in - is on the next page.
Next: How it works →

A wireframe view of a store floor, overlaid with a heatmap showing where customers congregate and tracked movement paths crossing the entrance

Stop reporting the number. Start moving it.

A Discovery Session works through your estate, your levers and your objectives, and leaves you with a view of where the opportunity is likely to sit and what a Proof of Concept would measure.

The form didn't load. Book a discovery session on our contact page.

No obligation. No hard sell. We'll come back to you within one working day.

Prefer email? sales-emea@glimpseanalytics.com